Getting started with D3
D3 is a JavaScript library that provides a way to join data with visualization. It is excellent for generating graphs, charts, diagrams and what not. D3 is highly flexible and can accommodate any kind of data to add the required visualization. However, the concepts are a bit tricky and need to be understood properly in order to play around.
D3 has the potential to update the DOM in HTML. Let’s look at the basic structure, how it selects, modifies, adds and updates elements.
Step1. As a first step, get the latest D3 package from here and add to your HTML body.
Step2. Now, we need to allocate an element in the DOM for the d3 visualization.
            <div id="d3placeholder">
            </div>
Step3. Select the placeholder element, where the data need to go in, and join the data.
        const selection = d3.select('div#d3placeholder')
                        .selectAll('p')
                        .data([20,40,50,60,70,80,39])
Step4. Enter the Selection and Append elements, attributes and styles as required.
        const draw = selection.enter()
                        .append('p')
                        .attr('style', d => 'font-size: '+ d + 'px;')
                        .text(d => d)
Note: Once you have created a selection by joining the data as in Step 3, you can pass the data as function to each element after the append. This is what gives you huge potential to manipulate and style your HTML document.
Output

Using the Power of SVG and D3 together to generate visualization
SVG has great potential to generate different visualization by utilizing coordinates in the HTML DOM. It can draw lines, circles or even a random path. We will use the power to SVG to create visualization by joining data with the help of D3.
Draw a Line
1. SVG Code that creates a square using lines.
                <svg width="500" height="500">
                    <line x1="0" y1="0" x2="500" y2="0" stroke='blue' strokeWidth="5" />
                    <line x1="0" y1="0" x2="0" y2="500" stroke='blue' strokeWidth="5" />
                    <line x1="500" y1="0" x2="500" y2="500" stroke='blue' strokeWidth="5" />
                    <line x1="0" y1="500" x2="500" y2="500" stroke='blue' strokeWidth="5" />
                </svg>

Now, let’s look at the d3 code that will give the same square.
HTML Block
                <svg id="d3square">
                </svg>
JavaScript
        const joinData = d3.select("svg#d3square")
                            .attr("height", 500)
                            .attr("width", 500)
                            .selectAll("line")
                            .data([
                                {x1: 0, y1: 0, x2: 500, y2: 0},
                                {x1: 500, y1: 0, x2: 500, y2: 500},
                                {x1: 500, y1: 500, x2: 0, y2: 500},
                                {x1: 0, y1: 500, x2: 0, y2: 0}
                            ])

        joinData.enter()
                .append("line")
                .attr('x1', d => d.x1)
                .attr('y1', d => d.y1)
                .attr('x2', d => d.x2)
                .attr('y2', d => d.y2)
                .attr('stroke', 'blue')
                .attr('stroke-width', '5')
2. SVG Code to create a line graph
                  <svg id="lineGraph" width="600" height="500">
                    <g>
                        <circle r="6" cx="10" cy="35" fill='red' />
                        <circle r="6" cx="110" cy="106" fill='red' />
                        <circle r="6" cx="210" cy="405" fill='red' />
                        <circle r="6" cx="310" cy="140" fill='red' />
                        <circle r="6" cx="410" cy="190" fill='red' />
                        <circle r="6" cx="510" cy="305" fill='red' />
                    </g>
                    <g>
                        <line x1="10" y1="35" x2="110" y2="106" stroke='blue' strokeWidth="2" />
                        <line x1="110" y1="106" x2="210" y2="405" stroke='blue' strokeWidth="2" />
                        <line x1="210" y1="405" x2="310" y2="140" stroke='blue' strokeWidth="2" />
                        <line x1="310" y1="140" x2="410" y2="190" stroke='blue' strokeWidth="2" />
                        <line x1="410" y1="190" x2="510" y2="305" stroke='blue' strokeWidth="2" />
                    </g>
                    <g>
                        <text x="15" y="35">10,35</text>
                        <text x="215" y="405">210,405</text>
                        <text x="315" y="140">310,140</text>
                        <text x="415" y="190">410,190</text>
                        <text x="515" y="305">510,305</text>
                    </g>
                </svg>

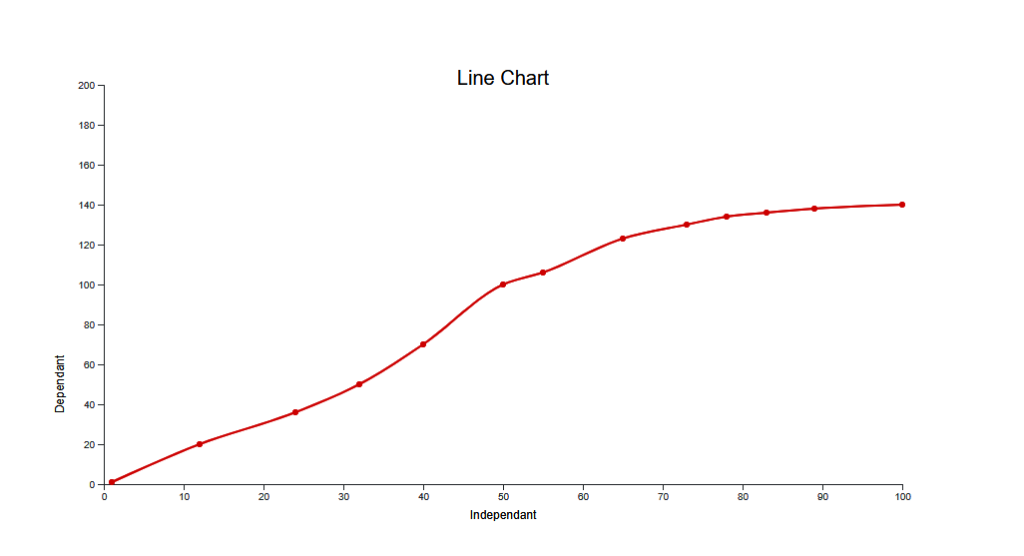
Now, let’s look at the D3 code that can generate the same line graph
HTML Block
                <svg id="lineGraph">
                </svg>
JavaScript
        // Step 1
        var dataset1 = [
            [1,1], [12,20], [24,36],
            [32, 50], [40, 70], [50, 100],
            [55, 106], [65, 123], [73, 130],
            [78, 134], [83, 136], [89, 138],
            [100, 140]
        ];

        // Step 3
        var svg = d3.select("svg#lineGraph"),
            margin = 200,
            width = svg.attr("width") - margin, //300
            height = svg.attr("height") - margin //200

        // Step 4
        var xScale = d3.scaleLinear().domain([0, 100]).range([0, width]),
            yScale = d3.scaleLinear().domain([0, 200]).range([height, 0]);

        var g = svg.append("g")
            .attr("transform", "translate(" + 100 + "," + 100 + ")");

        // Step 5
        // Title
        svg.append('text')
        .attr('x', width/2 + 100)
        .attr('y', 100)
        .attr('text-anchor', 'middle')
        .style('font-family', 'Helvetica')
        .style('font-size', 20)
        .text('Line Chart');

        // X label
        svg.append('text')
        .attr('x', width/2 + 100)
        .attr('y', height - 15 + 150)
        .attr('text-anchor', 'middle')
        .style('font-family', 'Helvetica')
        .style('font-size', 12)
        .text('Independant');

        // Y label
        svg.append('text')
        .attr('text-anchor', 'middle')
        .attr('transform', 'translate(60,' + height + ')rotate(-90)')
        .style('font-family', 'Helvetica')
        .style('font-size', 12)
        .text('Dependant');

        // Step 6
        g.append("g")
         .attr("transform", "translate(0," + height + ")")
         .call(d3.axisBottom(xScale));

        g.append("g")
         .call(d3.axisLeft(yScale));

        // Step 7
        svg.append('g')
        .selectAll("dot")
        .data(dataset1)
        .enter()
        .append("circle")
        .attr("cx", function (d) { return xScale(d[0]); } )
        .attr("cy", function (d) { return yScale(d[1]); } )
        .attr("r", 3)
        .attr("transform", "translate(" + 100 + "," + 100 + ")")
        .style("fill", "#CC0000");

        // Step 8
        var line = d3.line()
        .x(function(d) { return xScale(d[0]); })
        .y(function(d) { return yScale(d[1]); })
        .curve(d3.curveMonotoneX)

        svg.append("path")
        .datum(dataset1)
        .attr("class", "line")
        .attr("transform", "translate(" + 100 + "," + 100 + ")")
        .attr("d", line)
        .style("fill", "none")
        .style("stroke", "#CC0000")
        .style("stroke-width", "2");

Draw a Scatter Plot
You can use the above logic to draw a scatter plot. You just skip the drawing of the path, which is step 8.
HTML Block
                <svg id="lineGraph">
                </svg>
JavaScript
        // Step 1
        var dataset1 = [
            [1,1], [12,20], [24,36],
            [32, 50], [40, 70], [50, 100],
            [55, 106], [65, 123], [73, 130],
            [78, 134], [83, 136], [89, 138],
            [100, 140]
        ];

        // Step 3
        var svg = d3.select("svg#lineGraph"),
            margin = 200,
            width = svg.attr("width") - margin, //300
            height = svg.attr("height") - margin //200

        // Step 4
        var xScale = d3.scaleLinear().domain([0, 100]).range([0, width]),
            yScale = d3.scaleLinear().domain([0, 200]).range([height, 0]);

        var g = svg.append("g")
            .attr("transform", "translate(" + 100 + "," + 100 + ")");

        // Step 5
        // Title
        svg.append('text')
        .attr('x', width/2 + 100)
        .attr('y', 100)
        .attr('text-anchor', 'middle')
        .style('font-family', 'Helvetica')
        .style('font-size', 20)
        .text('Scatter Plot');

        // X label
        svg.append('text')
        .attr('x', width/2 + 100)
        .attr('y', height - 15 + 150)
        .attr('text-anchor', 'middle')
        .style('font-family', 'Helvetica')
        .style('font-size', 12)
        .text('Independant');

        // Y label
        svg.append('text')
        .attr('text-anchor', 'middle')
        .attr('transform', 'translate(60,' + height + ')rotate(-90)')
        .style('font-family', 'Helvetica')
        .style('font-size', 12)
        .text('Dependant');

        // Step 6
        g.append("g")
         .attr("transform", "translate(0," + height + ")")
         .call(d3.axisBottom(xScale));

        g.append("g")
         .call(d3.axisLeft(yScale));

        // Step 7
        svg.append('g')
        .selectAll("dot")
        .data(dataset1)
        .enter()
        .append("circle")
        .attr("cx", function (d) { return xScale(d[0]); } )
        .attr("cy", function (d) { return yScale(d[1]); } )
        .attr("r", 3)
        .attr("transform", "translate(" + 100 + "," + 100 + ")")
        .style("fill", "#CC0000");

Draw a Pie Chart
Follow the below d3 code to draw a Pie Chart
HTML Block
            <svg id="d3placeholder">
            </svg>
JavaScript
        // Step 1
        var data = [
            {name: "Alex", share: 20.70},
            {name: "Shelly", share: 30.92},
            {name: "Clark", share: 15.42},
            {name: "Matt", share: 13.65},
            {name: "Jolene", share: 19.31},
            {name: "Baby", share: 11.31},
            {name: "Gary", share: 14.31},
            {name: "Joone", share: 21.31},
            {name: "Bolane", share: 35.31}
        ];

        // Step 2
        var svg = d3.select("svg#d3placeholder"),
        width = 500,
        height = 400,
        radius = 200;

        // Step 3
        svg.attr('width', width)
        .attr('height', height)

        // Step 4
        var g = svg.append("g")
                   .attr("transform", "translate(" + width / 2 + "," + height / 2 + ")");

        // Step 5
        var ordScale = d3.scaleOrdinal()
                        	.domain(data)
                        	.range(['#ffd384','#94ebcd','#fbaccc','#96877e','#fa7f72','#996c43','#30c659','#3d56ba','#ff5733','#ffc300','#ba533d']);

        // Step 6
        var pie = d3.pie().value(function(d) {
                return d.share;
            });

        var arc = g.selectAll("arc")
                   .data(pie(data))
                   .enter();

        // Step 7
        var path = d3.arc()
                     .outerRadius(radius)
                     .innerRadius(0);

        arc.append("path")
           .attr("d", path)
           .attr("fill", function(d) { return ordScale(d.data.name); });

        // Step 8
        var label = d3.arc()
                      .outerRadius(radius)
                      .innerRadius(0);

        arc.append("text")
           .attr("transform", function(d) {
                return "translate(" + label.centroid(d) + ")";
           })
           .text(function(d) { return d.data.name; })
           .attr('text-anchor', 'middle')
           .style("font-family", "arial")
           .style("font-size", 15);

Draw a Bar Graph
Use the below D3 code to generate bar graphs.
HTML Block
            <svg id="d3placeholder">
            </svg>
JavaScript
        var dataset1 = [33, 57, 84, 21, 60]

        var svgWidth = 900,
            svgHeight = 600

        var margin = 200,
            width = svgWidth - margin,
            height = svgHeight - margin

        var svg = d3.select("svg#d3placeholder")
                    .attr('width', svgWidth)
                    .attr('height', svgHeight)

        var xScale = d3.scaleBand().range([0, width]).padding(0.5),
                    yScale = d3.scaleLinear().range([height, 0]);

        var g = svg.append("g")
                    .attr("transform", "translate(" + 100 + "," + 100 + ")");


        xScale.domain(dataset1);
        yScale.domain([0, 100]);

        g.append("g")
            .attr("transform", "translate(0," + height + ")")
            .call(d3.axisBottom(xScale).tickFormat(function(d){
            return "sale: " + d;
            })
            );

        g.append("g")
            .call(d3.axisLeft(yScale).tickFormat(function(d){
                return "$" + d;
            }).ticks(4));


        g.selectAll(".bar")
            .data(dataset1)
            .enter().append("rect")
            .attr("class", "bar")
            .attr('fill', 'red')
            .attr("x", function(d) { return xScale(d); })
            .attr("y", function(d) { return yScale(d); })
            .attr("width", xScale.bandwidth())
            .attr("height", function(d) { return height - yScale(d); });

Draw a Family Tree
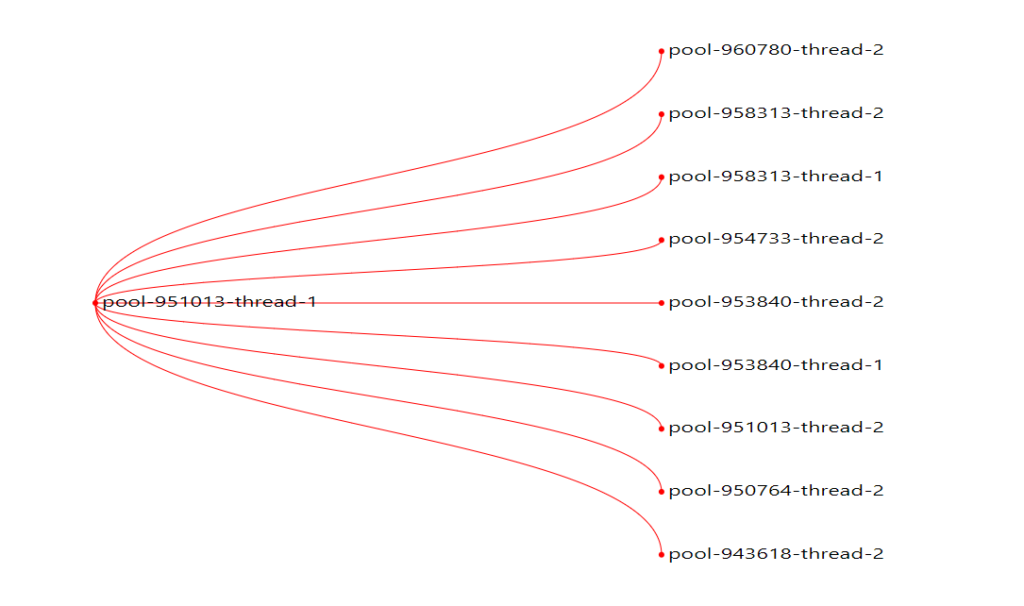
Follow the below d3 code to generate the family tree with cubic curve connectors
HTML Block
            <svg id="familytreesvg">
              <g id="cubiccurves"></g>
              <g id="circles"></g>
              <g id="texts"></g>
            </svg>
JavaScript
        let data = d3.hierarchy({
            name: "pool-951013-thread-1",
            children: [
              {
                name: "pool-960780-thread-2"
              },
              {
                name: "pool-958313-thread-2",
              },
              {
                name: "pool-958313-thread-1",
              },
              {
                name: "pool-954733-thread-2",
              },
              {
                name: "pool-953840-thread-2",
              },
              {
                name: "pool-953840-thread-1",
              },
              {
                name: "pool-951013-thread-2",
              },
              {
                name: "pool-950764-thread-2",
              },
              {
                name: "pool-943618-thread-2",
              }
            ]
          })

  const dimentions = {
    width: 900,
    height: 900
  }

  const treeLayout = d3.tree().size([dimentions.width - 300, dimentions.height - 300])

  const information = treeLayout(data)

  const circles = d3.select("svg#familytreesvg g#circles")
                    .selectAll("circle")
                    .data(information.descendants())

  d3.select("svg#familytreesvg")
    .attr("width", dimentions.width)
    .attr("height", dimentions.height)

  d3.select("svg#familytreesvg g#circles")
    .attr("transform", "translate(50,50)")

  d3.select("svg#familytreesvg g#lines")
    .attr("transform", "translate(50,50)")

  d3.select("svg#familytreesvg g#cubiccurves")
    .attr("transform", "translate(50,50)")

  d3.select("svg#familytreesvg g#texts")
    .attr("transform", "translate(50,50)")

    circles.enter()
        .append("circle")
        .attr("cx", d => d.y)
        .attr("cy", d => d.x)
        .attr("r", 3)
        .attr('fill', 'red')

    const texts = d3.select("svg#familytreesvg g#texts")
        .selectAll("text")
        .data(information.descendants())

    texts.enter()
        .append("text")
        .text(d => d.data.name)
        .attr("x", d => d.y + 7)
        .attr("y", d => d.x + 4)
        .attr('textLength', "15%")
        .attr('lengthAdjust', 'spacingAndGlyphs')

   const connectionPaths = d3.select("svg#familytreesvg g#cubiccurves")
    .selectAll('path')
    .data(information.links())

    connectionPaths.enter()
      .append('path')
      .attr('d', d => "M " + d.source.y + "," + d.source.x+ " C " + d.source.y + "," + (d.source.x+d.target.x)/2 + " " + d.target.y + "," + (d.source.x+d.target.x)/2 + " " + d.target.y + "," + d.target.x)
      .attr('stroke', 'red')
      .attr('fill', 'none')
      .attr('stroke-width', 1)

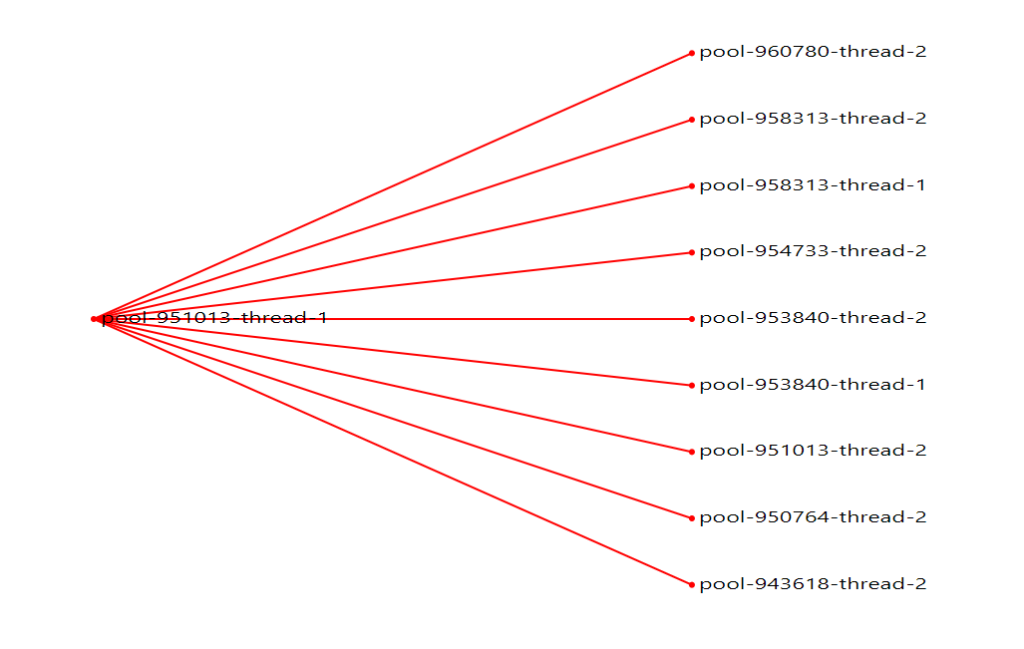
Follow the below d3 code to generate the family tree with straight line connectors
HTML Block
            <svg id="familytreesvg">
              <g id="circles"></g>
              <g id="lines"></g>
              <g id="texts"></g>
            </svg>
JavaScript
        let data = d3.hierarchy({
            name: "pool-951013-thread-1",
            children: [
              {
                name: "pool-960780-thread-2"
              },
              {
                name: "pool-958313-thread-2",
              },
              {
                name: "pool-958313-thread-1",
              },
              {
                name: "pool-954733-thread-2",
              },
              {
                name: "pool-953840-thread-2",
              },
              {
                name: "pool-953840-thread-1",
              },
              {
                name: "pool-951013-thread-2",
              },
              {
                name: "pool-950764-thread-2",
              },
              {
                name: "pool-943618-thread-2",
              }
            ]
          })

  const dimentions = {
    width: 900,
    height: 900
  }

  const treeLayout = d3.tree().size([dimentions.width - 300, dimentions.height - 300])

  const information = treeLayout(data)

  const circles = d3.select("svg#familytreesvg g#circles")
                    .selectAll("circle")
                    .data(information.descendants())

  d3.select("svg#familytreesvg")
    .attr("width", dimentions.width)
    .attr("height", dimentions.height)

  d3.select("svg#familytreesvg g#circles")
    .attr("transform", "translate(50,50)")

  d3.select("svg#familytreesvg g#lines")
    .attr("transform", "translate(50,50)")


  d3.select("svg#familytreesvg g#texts")
    .attr("transform", "translate(50,50)")

    circles.enter()
        .append("circle")
        .attr("cx", d => d.y)
        .attr("cy", d => d.x)
        .attr("r", 3)
        .attr('fill', 'red')

    const texts = d3.select("svg#familytreesvg g#texts")
        .selectAll("text")
        .data(information.descendants())

    texts.enter()
        .append("text")
        .text(d => d.data.name)
        .attr("x", d => d.y + 7)
        .attr("y", d => d.x + 4)
        .attr('textLength', "15%")
        .attr('lengthAdjust', 'spacingAndGlyphs')

    const connections = d3.select("svg#familytreesvg g#lines")
      .selectAll('line')
      .data(information.links())

    connections.enter()
      .append('line')
      .attr('x1', d => d.source.y)
      .attr('y1', d => d.source.x)
      .attr('x2', d => d.target.y)
      .attr('y2', d => d.target.x)
      .attr('stroke', 'red')
      .attr('fill', 'none')
      .attr('stroke-width', 2)
