Common Java Troubleshooting, Monitoring and Performance Tools to Instrument Java Process and Tune Performance?
For our discussion, we will consider a running Tomcat container as the java process, but it can be applied to any other java process. Monitoring a java process consists of detecting below values at runtime, followed by tuning:
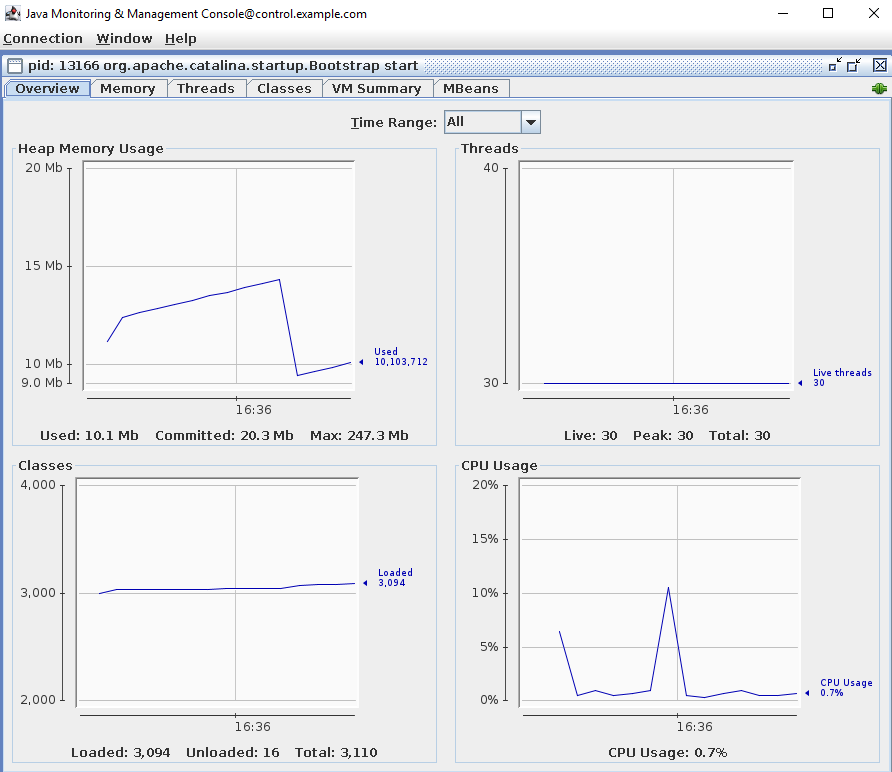
- Heap Memory Usage
- Threads
- GC
- Classes Loaded
- CPU Usage
- Checking MBean Values
Below Tools with any java distribution and can be used to detect values at runtime and troubleshoot further. I will explain the usage of each of them clearly.
- JCONSOLE
- JSTAT
- JSTACK
- JMAP
JCONSOLE
- Open the jconsole binary under <JAVA_HOME>/bin/jconsole. If running from the same host, where the java process is running, it can detect automatically as shown below. However, you can use the Remote Process section to key in details, if connecting remotely:
2. As soon as jconsole connects to the process, it starts showing the runtime stats
3. Memory Section shows in detail about the different memory division in Java Heap
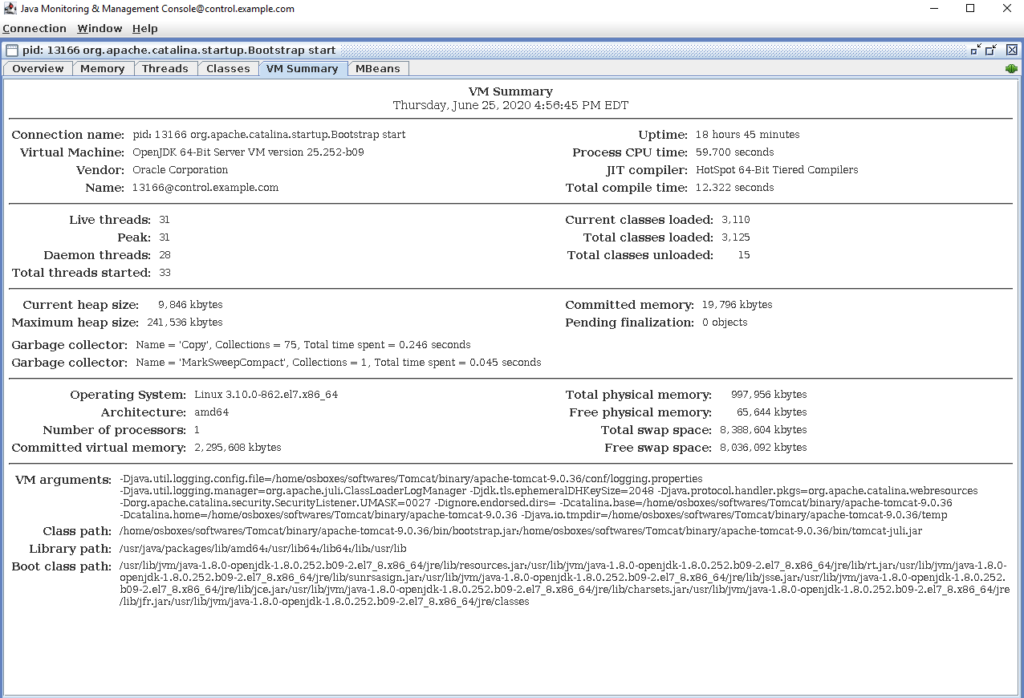
4. In the VM Summary, we see every details about the java process, including Uptime, Live Threads, Current Heap Usage, Max Heap Defined, OS memory/CPU, VM Arguments, Classpath and many more.
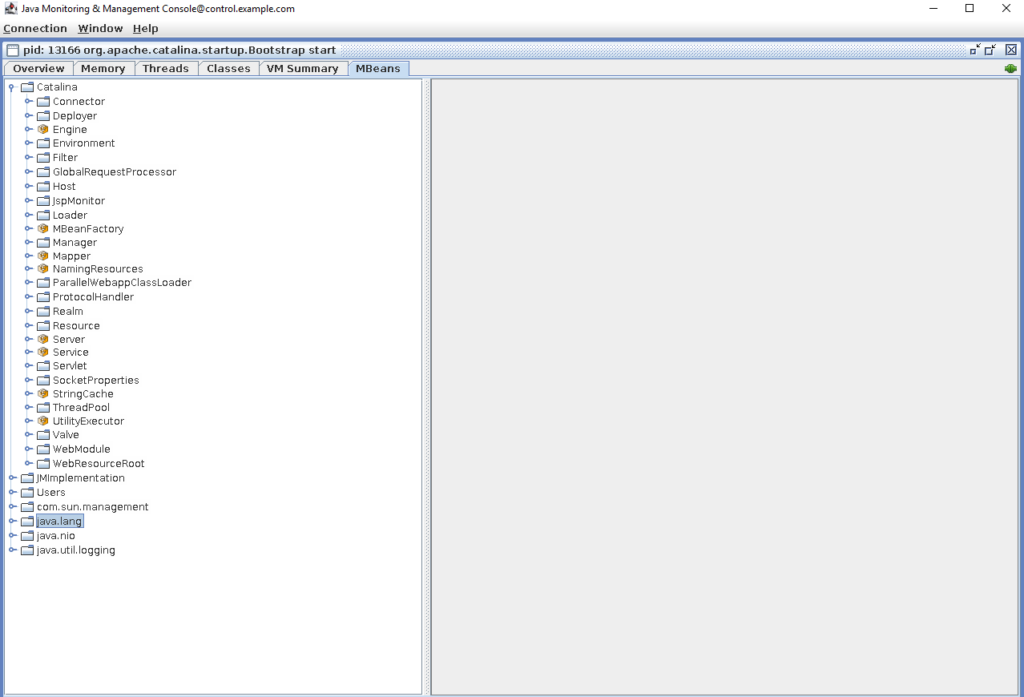
5. In the MBean section, you can see each and every value set in the JVM at runtime.
JSTAT
jstat is a command line tool collect thread dumps, You can fire below command to do the same:
jstat -gc <Process ID>|awk '!/[A-Z]/{ s=($3+$4+$6+$8); print s;}'

=> This will give you the current heap size in MB
JSTACK
jstack is a much better way of collecting thread dumps, where we can direct the dump into a separate file as compared to standard out files. Here is the command to do that:
jstack -l  <pid> > <file-path>
e.g jstack -l  212313 > /tmp/thread_dump
JMAP
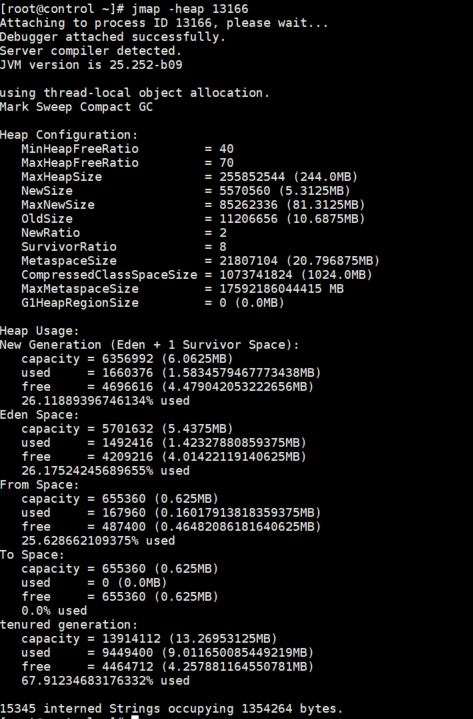
- jmap can be used to check the current memory and the different parts of heap e.g. eden space, survivor space, old gen etc.
- It can also help to collect heap dumps
jmap -heap <pdi>
jmap -dump:format=b,file=/tmp/heapdump <pid>


