How to Troubleshoot Java High CPU Usage Issues in Linux?
High CPU in java applications are due to huge volume of incoming requests or some intensive task performed within the code. To troubleshoot such issues, follow the below simple steps to correlate the CPU threads called LWPs (Light Weight Processes) and the Java threads.
Step1.
Execute the top command to detect the exact Java process ID (PID) consuming High CPU
Step2.
Execute the following command to get the LWP details.
ps -eLo pid,lwp,pcpu,vsz,comm | grep 21076 > OS_LWP
Step3.
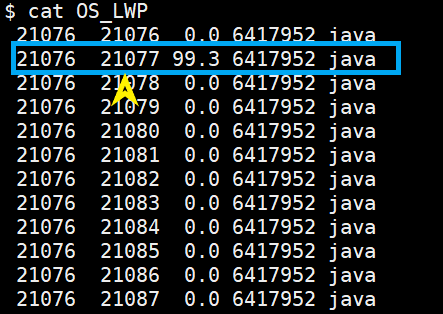
Output from Step2 displays all the Light Weight Process IDs (LWP) associated with the Java Process (PID = 21076)
LWPs denote the CPU threads. From below output, the problematic CPU thread ID is 21077
Step4.
Get a thread dump of the Java process using any of the below commands
kill -3 PID
OR
jstack PID > jstack_thread_dump
Step5.
The LWP ID is in decimal format, whereas the corresponding ID in java thread dump is in hexadecimal format. Converting LWP ID (=21077) to hexadecimal yields 5255, which is represented as 0x5255
Step6.
Search for the hexacimal ID (0x5255) in the thread dump, and it shows the exact Java thread causing the high CPU. Thread dumps log these CPU threads as nid (Native Thread ID)
From below image, we clearly see the thread with nid=0x5255, and is currently in the runnable state. It also shows the Java Class (Main.java) and the line number (=5) which causes the High CPU Usage.
So, now you know how to correlate the CPU and Java threads to find the exact cause of HIgh CPU Usage in Linux.


Nice article
In my case when I execute kill -3 pid nothing happens, kindly reply.
kill -3 should provide you the thread dump. Can you please share the output of the below commands:
2. kill -3
1. ps -ef|grep
Hi, the below command is not giving the expected output as per your above example
ps -eLo pid,lwp,pcpu,vsz,comm | grep 21076 > OS_LWP
In my server, even though it is more than 200%… still it does not capture that.
Please help.